


Microsoft releases Clarity–a free web analytics platform–for website administrators to precisely understand user behavior with videos, heatmap, and other insights. Clarity goes beyond what Google Analytics offers, thereby simplifying the way administrators assimilate user activity. Besides, it integrates with Google Analytics to collect the data and provides metrics of user engagement.
Watch User Behaviour
With Microsoft Clarity, you can view the recorded video sessions of users’ interactions with web pages. These videos are screen recorders of users, which showcase web pages’ scroll and interaction with elements.
However, the recorded videos hide sensitive information to comply with various data regulations of different countries. For instance, if a user is providing its email id for a newsletter subscription, you will see a symbol instead of the text to protect privacy.
This makes it better than Google Analytics, which only offers graphs and other visualizations. While those insights by Google Analytics are helpful, nothing beats the value provided by user behavior recordings.
Must-Use Filters:
There are multiple filters in the recorded sessions, which can be used to go more in-depth of the user behavior. For one, rage clicks; it shows which parts of web pages users are clicking continuously. This indicates that users are expecting a hyperlink while interacting with elements. Such insights allow administrators to fix the issue by providing relevant hyperlinks.
Similarly, Excessive scrolling filters will show you the recordings of rapid scrolling. This demonstrates that either the user is not interested in the displayed content or is looking for something (link or product) that is not apparent.
Understand What Your Users Like
Heatmaps–another feature–by Microsoft Clarity shows which portion of your website is more interesting to users. Heatmaps come in two forms–clickmaps and scrollmaps. While clickmaps show which content on web pages are vital to your users, scrollmaps show whether your users see what’s important.
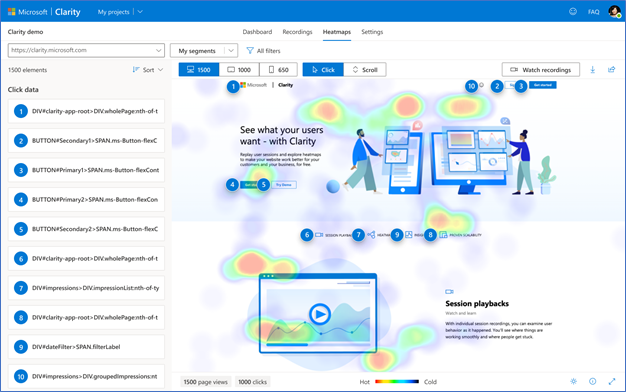
In the above picture, the regions with a red mark tell where users have clicked more often. This can help you align your expectations with reality by making the necessary changes to the website’s design.
A Dashboard To View The Overall Performance
Although the dashboard is not as good as Google Analytics, it provides analysis like average scroll depth percentage, dead clicks (click on an element with no effect), and more. Apart from this, it offers basic analytics such as sessions count, page per session, operating systems, users’ country, among others.
Also Read: Qlik Beams In BARC’s The BI & Analytics Survey 21 Results
Outlook
While Microsoft, at least with the current version, might not be able to replace Google Analytics, it is an exceptional extension to the existing web analytics platform you might be using. Google Analytics is being given a run for its money as several companies like Cloudfare and Microsoft are tapping into the web analytics market. While Cloudflare is focusing on privacy, Clarity is offering superior features. Google Analytics needs to re-think its strategy in order to hold on to its market share.
